Forex Trading Simulator is a new original tool designed for practicing Forex trading.
The idea behind the tool was to make it very lightweight and easy to use, but still fully simulate real trading environment.
Tool development is ongoing. We need your feedback! Leave a comment on this page or just send us an e-mail. Thanks in advance!
Installation
Extract the downloaded ForexSimulator-x.y.zip archive in some folder. Then double-click on the ForSimSetup.exe. The installer will start.
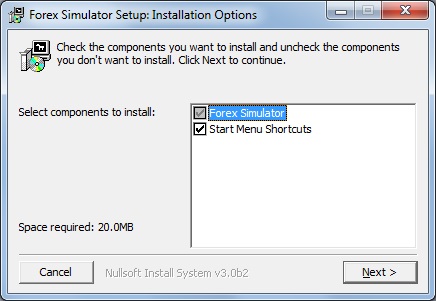
Click “Next” button and then select the installation folder.
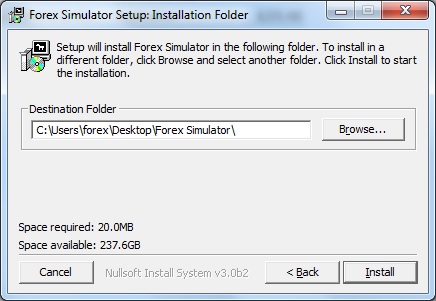
Next, click “Install” button and wait for the installation to complete.
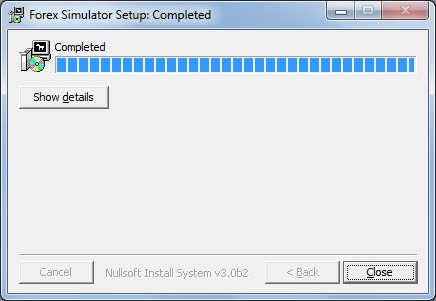
Now, click “Close” button. You are all set. Now you can run the software from the Windows Start Menu.
License
On start-up, the Simulator will show the “License” – tab. Without a valid license, the software works as a Demo. In this mode, you can practice on the live data feed only, but not on the historical data. Also changing setting is not possible.
If you have a license, enter your email address you uses for purchase, and the license code received, and press “Validate” – button.
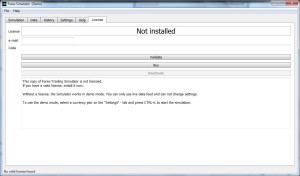
If the credentials entered are correct, you will see the license status changed to “INSTALLED“. Subsequent incremental installations will not require any actions from you, as long as you don’t uninstall the software prior to installing a new version.
You can remove the license yourself by using “Deactivate” – button. This is useful if you need to transfer the license to another machine.
Test Data
The Simulator can work in back testing mode, and also on live data in real time.
For the back testing, historical tick-by-tick market data must be presented as .csv files. You can download free high quality tick-by-tick data from www.truefx.com. There you can get the historical data for 15 main currency pairs since 2009.
The quotes are available as a monthly files. Download a file to your computer and unzip it. (Here is a sample one-day tick data file for you just to try)
Now, in “File” menu, select “Open“, and choose a quotes file you would like to test on. The simulator will show you the calendar where the uploaded data interval will be shown light colored, with the first available date highlighted in blue.
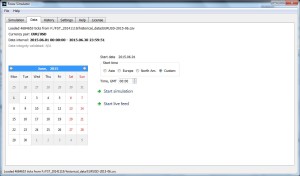
Now, select the desired simulation start date by clicking on it in the calendar, and then select the start time. The available options include manual time select (after file upload, it is set to the time of the first tick in the file), and standard times of trading sessions – Asian, European and North American.
Once you finished selection, click on “Start Simulation” – button. The Simulator will switch to the “Simulation” – tab and the data feed will start.
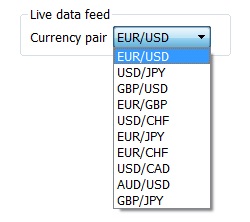
To run the simulation in real-time, click on “Start live feed” – button. The Simulator uses streaming quotes for 10 main currency pairs provided by www.truefx.com.
Currency pair for the live simulation is selected on “Settings” – tab.
Simulation
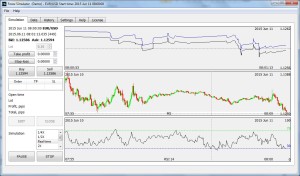
The upper graph shows ticks.
The middle graph shows averaged quotes, e.g. M15. The light horisontal bar shows the value range from the tick graph. The dashed vertical lines mark change in date.
The bottom graph is reserved for indicators (in version 1.x, only RSI is supported).
On the “Settings” tab, you can select the visible data window size, averaging interval, and the indicator parameters (in version 1.x – RSI periods).
Data feed options
By default, the data feed is started in real-time mode. It means that ticks are sourced at exactly the same intervals as they appeared in the market.
In 2X(4X) mode ticks are sourced twice (4 times) faster compared to the real-time mode. These modes are useful to save time when trading in quet markets. E.g. in Asian session the intervals between the ticks can exceed 1 min.
“Max” mode doesn’t limit the interval between ticks anyhow, so the feed speed only depends on your hardware. This option is used mainly for debugging and demonstrations.
In 1/2X (1/4X) mode, ticks are sourced twice (4 times) slower compared to the Real time mode. These modes can be used to practice trading in fast-paced markets, e.g. around the news release times.
You can put the current Simulation on hold with “Pause” button. To unhold the simulation, press “Resume” button. The trading history is kept.
To end Simulation, use “Stop” button. To start a new simulation, you need to go to “DATA” tab, and select the start time or upload a new data file. The trading history will be deleted.
Working with orders
You can place a market order using BUY and SELL buttons.
In the version 1.x you can place Stop-loss and Take profit orders only simultaneously with the main order. To set the SL and TP values, click the corresponding buttons to copy the current market price in the controls, and then adjust the values manually.
Note that the Simulator checks the distance to the market for SL and TP values. Min distance is controlled by the “Stoplevel” parameter on the “SETTINGS” tab. If any one of them is less than the parameter, the order fill error is returned.
The version 1.x only supports one active order. So once an order is placed, the only available operation is order closing at market. Limit orders are not supported in the version 1.x and the lot size is fixed.
Active order is shown with a dashed red line.
You can see the trade history on “History” tab.
History
In the upper table, all the orders opened during the current simulation are listed. For each order, opening and closing date/time, as well as SL and TP levels are shown. In the version 1.x the order profit is only shown in pips.
Below the order list, there is a simulation log. Each line represents an order open/close attempt or result. The timestamp corresponds to that of the historical data used. Also the server response delay is logged.
Settings
Here you can adjust the graphics parameters. For the tick graph, you can only select the size of the data window (min value – 10s).
For the averaged quote graph, you can set the data window size and averaging interval (M1/M5/M15/M30/H1). You can also select plotting mode: line or candlesticks.
For indicator graph, in version 1.x you can select the number of periods used in RSI calculation.
For all graphs, you can adjust the offset. If it is turned on, then the graphs will be plotted with a gap on the right. This might make viewing more comfortable.
For trading server parameters, in version 1.x you can set min and max values of the response delay. The Simulator generates a random delay value for each request.
Stoplevel (measured in pips, default 5) is a minimum distance to market when placing Stop loss and Take profit orders. The same value is used for both. Order fill fails if you try to place it closer to market.
Forex Trading Simulator – Future Development
Please do give us feedback! If a feature you want is not listed below, please leave a comment on this page or just send us an e-mail.
The new features coming up in the next releases:
- timeshift
- inbuilt tick data recorder
- trade recording and playback
- multiuser mode
- automated trader
Timeshift is similar to the same function in high-end DVRs. With it, you can enjoy pause/resume feature during a real-time simulation. This helps you use your time very efficiently.
If your practice is interrupted, you pause it but keep your Internet connection active. The Simulator continues receiving the market data. So later, you can resume your practice any time.
During the timeshift, the market data is collected by the tick data recorder. Of course, it’s not only used for timeshift. You can use it e.g. to record a trading session while you are at work during daytime. And then use the recording and practice on it while commuting home.
With trade recorder/player, you can save your practice and analyze it later.
In multiuser mode, you can practice together with your friends. You can even have a trading contest, which makes practicing fun. Here, one of the Simulators becomes a trading server for a group of people so that all would have the same market data.
Automated trader is similar to the multiuser mode, but here you can compete with an inbuilt automated trading strategy. Or record how this strategy works.